Introduction to Touch/No Touch
In the binary options market, traders will come across the same assets that are encountered in other markets. Since what is traded on the binary options market is contracts based on the price behavior of these same assets, it is essential that traders are familiar with the methods of technical analysis used in predicting this behavior.
Technical analysis simply means using chart information about repetitive trends to make a prediction about the behavior or future price movement of that asset in order to gain from such movements. Technical analysis can therefore be broadly classified into three main methods of analysis. These are:
a) Use of chart information (chart patterns and candlesticks)
b) Use of price action
c) Use of technical indicators
Use of Chart Information
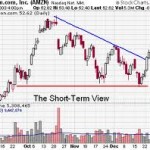
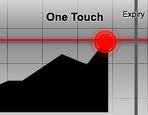 Chart information simply answers the question: what are the candlesticks telling you about the future price movement of this asset? If you can answer this question, then you have understood what chart information is all about.
Chart information is all about the candlesticks. When used in ones, in collection of twos or threes, candlesticks form patterns that are predictive of price movements. They can tell the trader about an impending reversal of the price of the asset (bullish or bearish) or about the continuation of the price of the asset in the same direction of the previous trend before a momentary halt in price movements due to profit taking. Some of these candlestick patterns have high reliability and can therefore be used alone, while others have lower reliability and therefore must be used with technical indicators to produce a tradable signal.
When many candlesticks are used as a collection, with attention being paid to the patterns formed by trend lines that connect their highs and lows, then we have what we call chart patterns. Chart patterns are highly predictive of asset behavior and price movements, and they can form the basis of very sound trades in the binary options market.
Traders do not need to master all the chart patterns or candlestick patterns. Rather a sound understanding and recognition of a few of these patterns is all the trader needs to put them to effective use. Traders will also need to know how to time their trades so that an expiry time/date does not catch the trade out in a bad position.
Use of Price Action
Using price action in technical analysis will require access to a Level II pricing system. This is where traders will have access to the Order Book, which is a documentation of all trade positions in a particular asset by the market participants who are trading that asset. That way, the trader will be able to tell where the volume of trade is shifting to, because volume drives demand and demand will drive prices. Lower volumes by major players will mean that the asset will lack momentum. Large volumes in one particular direction will drive prices in that direction. If the institutional traders are selling more of an asset, prices will fall. If they are buying up an asset in large volumes, prices will be driven northwards.
Most conventional binary options brokers do not provide Level II pricing. The trader may have to opt for a more institutionalized broker such as IG Markets to provide such facilities.
Use of Technical Indicators
The use of indicators is a key factor in technical analysis. Either alone or in combination with candlesticks, they provide a solid backbone on which technical analysis can be carried out. Indicators can be classified into trend-seeking indicators (which determine the trend of the asset) and momentum indicators (which indicate the strength in a trend). Indicators could also be default or custom-made by the trader.
Whatever the indicator type or model, they all serve the same purpose, which is to derive trading signals that can be used to trade an asset profitably.
Conclusion
The problem that many traders will confront in the binary options market is that of not having access to charting tools and technical indicators. While this is a key deficiency on many trading platforms, it can easily be overcome by making use of tools provided by brokers in the conventional markets where these assets are traded. For instance, many forex brokers are now stepping out of the realm of currencies alone to offer mini-contracts on gold, silver, oil, and several stock indices. These tools can be exploited by the trader to conduct technical analysis, and the results adapted to the binary options market.