Introduction to Technical Analysis
 In the binary options market, the same assets that are traded are the same assets that traders will encounter in other individual financial markets. The assets are the same and the same movements in price are depicted on the binary options platforms. If the character, behavior and pricing of these assets are the same in the binary options markets as they are in other markets, then are there any limitations to the use of the same methods of technical analysis in determining how to trade them in the binary options markets? The answer is an obvious NO.
Technical analysis is all about detecting repetitive trends on the charts in order to ascertain a pattern that can be used to predict a future price movement. These trends can be predicted in three ways:
a) Detecting chart patterns that always signify that the asset will behave in a certain way.
b) Using certain candlestick patterns that show that once again, the price of the asset is likely to behave in a particular manner.
c) Using technical indicators that have been programmed to automatically detect and predict what the price of an asset will do in a particular situation, simply waiting for the trader to abstract and utilize this information.
Use of Chart Patterns
In everyday use, anytime the word “pattern” is used, it is to connote something that has achieved a regularity of behavior, occurrence or activity. So we speak of a person’s hevaioural tendencies as “a pattern of behavior”, homicide detectives investigating the work of a serial killer talk of a “pattern” of killings, sports coaches talk of a playing pattern, etc. Look at a team like Barcelona FC. They have developed a playing pattern nicknamed “tiki taka”, which utilizes a short passing style of play to work the ball from their own area, keep possession and take it to the opponent’s area where the damage is done. This is what that team is known for and you will never find them resorting to the use of long balls from their area to that of the opponent.
It is the same thing when we talk of chart patterns. Over time, certain chart patterns have been associated with a particular price effect or price behavior and whenever these patterns appear on the financial charts, we can be sure that the same effect will hold. That is why chart patterns have become a mainstay of technical analysis and they can be deployed as a method of technical analysis with remarkable accuracy.
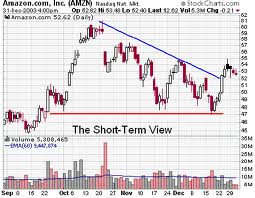
Chart patterns are formed by joining the highs and lows of candlesticks with trend lines to produce the characteristic shapes that constitute the pattern. Examples of chart patterns include triangles, diamonds, flags and pennants, cup and handle patterns, etc.
Use of Candlesticks
Candlesticks also form patterns. Candlesticks are used for depicting the price of an asset over a time period and there are occasions when they also form a definable pattern that serves as a predictor of future price movement. That is why we speak of reversal and continuation candlestick patterns. Examples are hammer, shooting star, Morning Doji Star, Evening Doji Star, Three Crows, Kicker pattern, etc.
In both the case of candlestick and chart patterns, some degree of skill is required to identify the patterns as these patterns do not just jump out at the trader so obviously.
Use of Technical Indicators
When used alone or in combination with patterns or candlesticks, technical indicators are very powerful tools of analysis. Their job is to show the way to a new event on the price chart; it is up to the trader to know what the indicator is saying and act accordingly. Some indicators are obtainable from the charts by default, but others can be programmed by the trader to identify an opportunity and signal the trader on what to do.
Conclusion
The problem that traders have generally with technical analysis is not in the shortage of tools or chart information, but with how to actually decode this information and apply the information in the trading decisions that are made. There is too much material that tells the trader what the technical analyses is supposed to show, but very little on how the trader can actually do the analysis himself and use the information accordingly. It is not enough to know that a hook can catch a fish. It is another to actually step into a boat and use one practically to catch a fish. This website will fill that gap and traders are advised to study the technical analysis articles that are listed on this site very closely.